

Billboards deliver measurable ROI when you plan placements strategically, track the right signals, and apply a clear attribution method. The simplest formula: ROI (%) = [(Revenue attributed to billboard – Campaign cost) ÷ Campaign cost] × 100. Run that calculation with honest inputs and you have a defensible number to bring to any budget conversation.
Two data points set the floor for expectations. According to an OAAA/Morning Consult study, 88% of U.S. adults. That reach and goodwill give the channel a strong foundation before you spend a dollar on creative.
Your immediate next step: pick one attribution method from the checklist in Section 4 and build it into your campaign before launch. Measurement set up after the fact is always harder and less reliable.
- Quick start: vanity URL or promo code, zero extra cost
- Better: geofencing or branded-search monitoring
- Best: holdout market comparison or geo-lift study
Key Takeaways
Billboards deliver strong, measurable ROI when campaigns are built with tracking infrastructure in place, run for a minimum of four to six weeks, and evaluated against declared assumptions rather than raw vendor impressions.
| Point | Details |
|---|---|
| Use the core ROI formula | ROI (%) = [(Revenue attributed – Campaign cost) ÷ Campaign cost] × 100, with declared inputs. |
| Set up tracking before launch | Vanity URL, call-tracking number, and branded search baseline must be in place before the creative goes live. |
| Benchmark against OAAA data | 69% of U.S. adults notice a billboard monthly; visually aided recall averages 47% across tested campaigns. |
| Declare your assumptions | State attribution window, conversion definition, and CPM baseline before presenting ROI to stakeholders. |
| 16wmediagroup builds in measurement | The agency sets up geo-lift, call tracking, and search monitoring before any media spend is committed. |
Table of Contents
- What billboard ROI actually means and the formulas to use
- The key performance metrics to track for billboard campaigns
- How to attribute results to a billboard and measure its contribution
- U.S. benchmarks and industry statistics to judge your campaign
- Step-by-step ROI calculations: a small business and a regional brand
- Practical tactics to improve your billboard ROI
- Common errors that hurt billboard ROI and how to fix them
- What billboard campaigns cost and when to expect measurable results
- How to think about ROI assumptions and communicate them clearly
- How 16wmediagroup measures and improves billboard ROI for local businesses
- When billboards are a smart investment and when to skip them
- 16wmediagroup can help you plan, place, and measure billboard campaigns
- Sources
What billboard ROI actually means and the formulas to use
“Billboard ROI” is an informal but widely used term for what media planners formally call out-of-home return on investment. It measures the difference between the revenue (or media value) a campaign generates and what the campaign costs, expressed as a percentage of that cost. The core formula is straightforward:
ROI (%) = [(Revenue attributed – Campaign cost) ÷ Campaign cost] × 100
A result above 0% means the campaign returned more than it cost.
Formula variants and when to use each
1. Direct-response ROI — best when you can tie a specific action (a call, a coupon redemption, a website visit via vanity URL) directly to the billboard.
- Inputs: number of attributed conversions × average order value = attributed revenue; subtract campaign cost; divide by campaign cost; multiply by 100.
2. CPM-based media-value approximation — useful when direct attribution is not possible and you want to benchmark the media buy against other channels. A step-by-step method from Portma uses a CPM baseline (commonly cited around $12 per 1,000 impressions) to convert impression estimates into a media-value figure, then layers conversion and average-order-value assumptions on top.
- Inputs: vendor-reported impressions ÷ 1,000 × CPM baseline = media value; apply estimated conversion rate × average order value = attributed revenue; run the standard ROI formula.
3. Blended brand-lift ROI — for campaigns where the primary goal is brand awareness. Translate brand-lift survey results (aided recall increase, purchase-intent shift) into a revenue proxy using your historical conversion-to-revenue ratios, then run the standard formula.
- Inputs: pre/post brand-lift survey, historical conversion rate from awareness to purchase, average customer value.
Required data sources for any variant:
- Sales data or CRM records (for attributed revenue)
- Web analytics (Google Analytics 4 or equivalent) for vanity URL traffic
- Vendor impression reports and third-party traffic counts for CPM calculations
- Brand-lift survey results (pre/post or test/control) for blended ROI
The key performance metrics to track for billboard campaigns
Impressions, reach, frequency, CPM, TRP/GRP, ad recall, conversion rate, branded search lift, foot traffic, and phone calls — these are the numbers that feed every ROI calculation. Modern campaigns prioritize measurable downstream signals like branded search increases and location visits alongside traditional awareness metrics.
Impressions: the total estimated number of times your billboard is seen. Vendors calculate this from traffic counts (daily effective circulation, or DEC) multiplied by a visibility adjustment factor. Validate vendor estimates against state DOT traffic data or third-party sources like Geopath.
Reach: the number of unique individuals exposed to the billboard at least once during the campaign period. Vendors typically derive this from panel data and mobility analytics.
Frequency: average number of times a reached individual sees the ad. Formula: Impressions ÷ Reach.
CPM (cost per thousand impressions): Campaign cost ÷ (Impressions ÷ 1,000). A $15,000 campaign generating 2,000,000 impressions yields a CPM of $7.50.
TRP/GRP (target/gross rating points): the percentage of your target audience reached, multiplied by average frequency. A TRP of 50 means your target audience received an average of 50 exposure opportunities per 100 people. Vendors calculate this from Geopath audience data.
Ad recall (visually aided and brand aided): measured via pre/post surveys. Visually aided recall shows respondents the creative and asks if they remember seeing it. Brand-aided recall asks if they associate the brand with the billboard without showing the creative.
Conversion rate: attributed conversions ÷ estimated impressions (or reach). For offline conversions, use promo codes, vanity URLs, or call tracking numbers as the attribution bridge.
Branded search lift: the percentage increase in branded keyword searches (your business name or tagline) during and after the campaign flight, measured in Google Search Console or Google Trends.
Foot traffic and phone calls: measured via geofencing analytics (comparing visit rates in exposed vs. unexposed areas) and dedicated call-tracking numbers (CallRail, for example).
Pro Tip: Never rely solely on vendor impression numbers. Cross-reference with Geopath ratings data or a third-party mobility analytics provider. A 10–15% variance between vendor and third-party estimates is common; anything wider deserves a conversation with your rep before you commit budget.
How to attribute results to a billboard and measure its contribution
Attribution is where most billboard campaigns fall apart. The channel is inherently broadcast, so you need a deliberate system to connect exposure to action. Here is a tiered checklist, ordered from simplest to most rigorous.
Tier 1: Quick (low cost, limited precision)
- Vanity URL: create a unique landing page URL (e.g., yourbrand.com/billboard) used only on the billboard creative. Track sessions in GA4. Avoid using this URL in any other channel to prevent double counting.
- Promo code: print a unique discount code on the billboard. Track redemptions in your POS or e-commerce platform. Set an expiration date that matches the campaign flight.
- Dedicated phone number: assign a unique call-tracking number (via CallRail or a similar service) to the billboard. Log call volume and duration.
Tier 2: Better (moderate cost, stronger signal)
- Geofencing and geo-lift: set a digital geofence around the billboard location. Measure whether people who passed the billboard visited your store or website at a higher rate than a matched control group. Mobile location analytics platforms provide this as a managed service.
- Branded search monitoring: track weekly branded keyword search volume in Google Search Console. A sustained lift during the campaign flight that returns to baseline after the campaign ends is a reliable signal of billboard-driven awareness.
Tier 3: Best (higher cost, most defensible)
- Holdout market comparison: run the billboard in one market and withhold it from a comparable market. Compare sales, web traffic, or branded search between the two markets over the same period. Regional sales comparisons between exposed and unexposed areas are among the most pragmatic methods for isolating billboard impact.
- Controlled lift study: commission a third-party measurement provider to run a matched-panel study. Respondents in the exposed group are compared to a statistically matched unexposed group on recall, purchase intent, and conversion.
- Blended measurement: combine two or more of the above methods. Weight each signal by its reliability and triangulate a composite ROI estimate.
Evidence from OOH effectiveness research confirms that while channel-level proof of billboard impact is strong, attributing results to a single billboard requires controlled methods. Blended measurement is the most honest approach for most campaigns.
Pro Tip: Run a holdout comparison only when your two markets are genuinely comparable in population size, seasonality, and competitive activity. A minimum of four weeks of baseline data before the campaign launch makes the comparison defensible. Smaller markets with clean geographic boundaries (a single metro DMA) work best.
U.S. benchmarks and industry statistics to judge your campaign
Setting realistic expectations before launch prevents the most common post-campaign disappointment: comparing a local billboard to a direct-response digital ad and declaring it a failure.
The OAAA/Morning Consult study puts billboard noticeability at 69% of U.S. adults. Those numbers reflect a channel that most Americans encounter and respond to positively.
On recall, a Nielsen/OAAA poster study found average visually aided ad recall of 47% across tested campaigns, with a normative range of 33%–62%. Campaigns using 40 or more poster units in medium and large markets tested at the higher end of that range. Scale matters: more units mean more exposures, which drives recall.
Stat to know: OAAA analysis positions OOH as delivering the greatest audience ROI of most major media channels when CPM, reach, and recall are evaluated together — a useful anchor when comparing billboard spend to digital or broadcast alternatives.
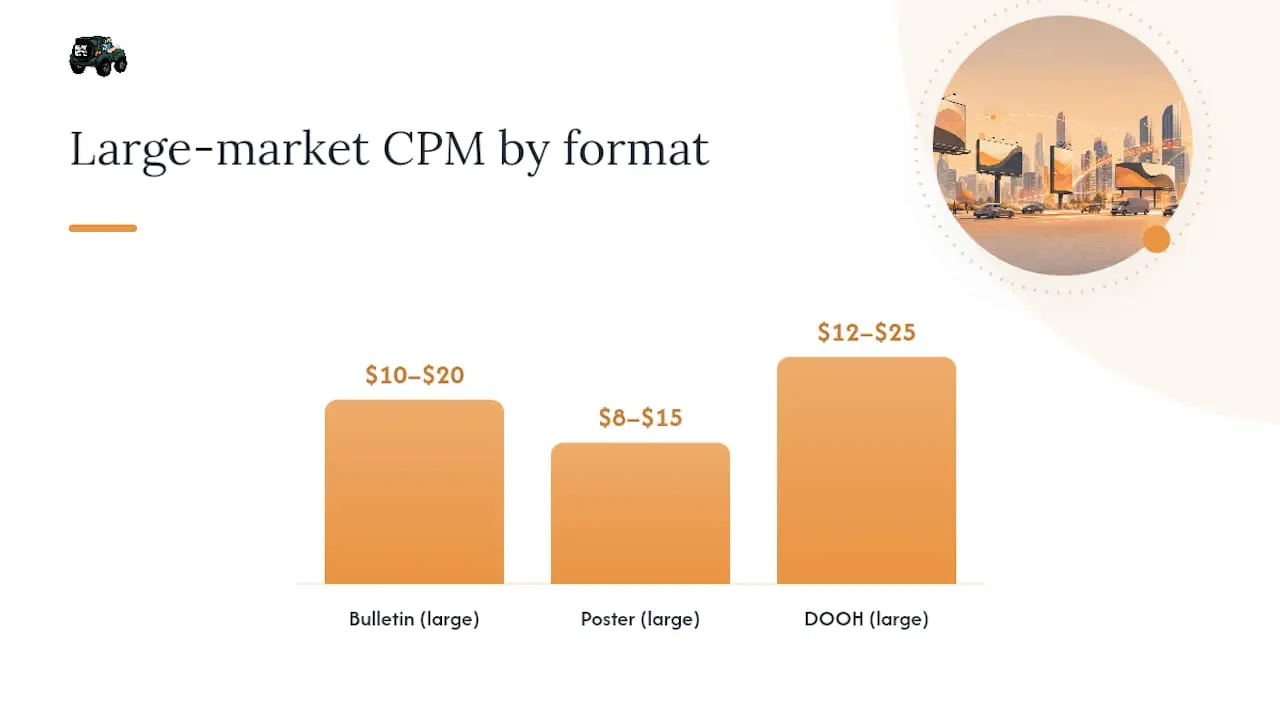
CPM benchmarks vary significantly by market size, format, and location. Illustrative U.S. ranges:
| Format | Small Market CPM | Mid-Size Market CPM | Large Market CPM |
|---|---|---|---|
| Bulletin (large format) | $2–$5 | $5–$10 | $10–$20 |
| Poster (medium format) | $1–$4 | $4–$8 | $8–$15 |
| Digital OOH (DOOH) | $3–$7 | $6–$12 | $12–$25 |
These are illustrative ranges based on industry-reported data. Actual CPMs depend on traffic volume, location desirability, vendor, and contract terms. Always request a Geopath-verified impression estimate from your vendor.
Recall, CPM, and noticeability all vary by creative quality, placement visibility, and audience composition. A billboard on a high-traffic interstate in Tampa will outperform a low-visibility side-street placement on every metric, even at the same nominal CPM.
Step-by-step ROI calculations: a small business and a regional brand
Small-business example
Inputs:
- Campaign cost: $3,000 (one bulletin, 4 weeks, mid-size market)
- Vendor-reported impressions: 500,000
- CPM baseline: $12 per 1,000 impressions (per Portma’s step-by-step method)
- Estimated conversion rate: 0.05% (5 per 10,000 impressions)
- Average order value: $80
Step-by-step:
- Media value: 500,000 ÷ 1,000 × $12 = $6,000
- Attributed conversions: 500,000 × 0.0005 = 250 conversions
- Attributed revenue: 250 × $80 = $20,000
- ROI: [($20,000 – $3,000) ÷ $3,000] × 100 = 467%
That sensitivity matters.
Regional brand example (CPM + TRP approach)
Inputs:
- Campaign cost: $25,000 (5 bulletins + 10 posters, 8 weeks, large market)
- Total impressions: 4,000,000
- TRP achieved: 120 (target audience: adults 25–54)
- CPM: $6.25 (blended across formats)
- Brand-lift survey result: +8 percentage points aided recall lift
- Historical conversion rate from awareness to purchase: 2%
- Average customer lifetime value: $350
Step-by-step:
- Media value: 4,000,000 ÷ 1,000 × $6.25 = $25,000 (at par with spend — confirms fair pricing)
- Incremental aware audience: TRP 120 in a target market of 500,000 adults = 600,000 gross impressions on target; apply +8pp recall lift to estimate 48,000 newly aware individuals
- Attributed conversions: 48,000 × 2% = 960 conversions
- Attributed revenue: 960 × $350 = $336,000
- ROI: [($336,000 – $25,000) ÷ $25,000] × 100 = 1,244%
Sensitivity analysis
| Variable | Base Case | Low Case | High Case |
|---|---|---|---|
| Conversion rate | 0.05% | 0.05% | 0.05% |
| Attributed revenue (SMB) | $20,000 | $10,000 | $40,000 |
| ROI (SMB) | 467% | 467% | 1,467% |
| CPM baseline | $12 | $8 | $16 |
| Media value (SMB) | $6,000 | $4,000 | $6,000 |
Small shifts in conversion rate move ROI more than CPM changes. That is why validating your conversion assumption with real tracking data (vanity URL, promo code) is worth the setup effort.
Calculation template — collect these inputs before you run your numbers:
- Campaign cost (total, including production)
- Vendor impression estimate (Geopath-verified preferred)
- CPM baseline for your market and format
- Attribution method and conversion count
- Average order value or customer lifetime value
- Campaign flight dates and attribution window
Practical tactics to improve your billboard ROI
The biggest ROI gains come from planning and creative decisions made before the campaign launches, not from optimization after the fact.
Plan by audience and route: match billboard locations to the daily commute patterns of your target customer. A restaurant targeting lunch-hour office workers needs placements on routes into the business district, not residential arterials.
Buy enough frequency: a single billboard seen once rarely converts. Aim for a TRP of at least 50 in your target market over a four-week flight. The Nielsen/OAAA poster study shows recall climbs meaningfully when campaigns use 40 or more units — scale and frequency are the same lever.
Sharpen creative for three-second comprehension: a driver has roughly three seconds to read your billboard. One image, one headline (seven words or fewer), one call to action. High contrast, large type, and a single brand color beat a cluttered design every time.
Add a trackable element to every creative: a vanity URL, a QR code linked to a dedicated landing page, or a promo code. Without one, you are flying blind on conversion data. For multi-channel advertising coordination, make sure the landing page matches the billboard’s message exactly.
Coordinate OOH timing with digital: run paid social or display retargeting to audiences who were geographically near your billboard during the campaign flight. This “surround sound” approach amplifies recall and drives measurable digital conversions that you can tie back to OOH exposure.
Monitor branded search weekly: set up a Google Search Console alert for your brand name. A lift in branded queries during the campaign flight is one of the cleanest signals that the billboard is driving awareness.
Use QR codes strategically: place the QR code in the lower third of the creative, large enough to scan from a stopped vehicle. Link it to a mobile-optimized landing page with a single conversion action. Track scans separately from direct URL traffic to avoid double counting.
Pro Tip: Pair your billboard with a local advertising best practices checklist before you finalize placements. The sequence matters: audience first, route second, creative third, tracking fourth. Reversing that order is the most common planning mistake.
Common errors that hurt billboard ROI and how to fix them
Most underperforming billboard campaigns share the same handful of mistakes. Each one has a straightforward fix.
Trusting raw vendor impressions without verification: vendor DEC numbers can be inflated. Fix: request Geopath-certified ratings and cross-check against state DOT traffic counts before accepting the impression estimate.
Underbuying frequency and TRP: one billboard for two weeks rarely moves the needle. Fix: commit to a minimum TRP of 50 over four weeks, or consolidate budget into fewer, higher-traffic locations rather than spreading thin.
Using illegible creative: small fonts, low contrast, and too many words kill recall. Fix: test your creative at thumbnail size on a phone screen. If you can’t read it in three seconds, neither can a driver.
Expecting immediate direct-response conversion: billboards build awareness over time. Fix: set a 30–60 day attribution window and track branded search lift as an early leading indicator before expecting sales signals.
Mixing exposed and unexposed markets when measuring: comparing a market running billboards to a market that also received other advertising creates noise. Fix: designate a clean control market with no concurrent OOH activity before the campaign starts.
Over-attributing digital conversions to billboards: if your digital retargeting targets people near your billboard, some of those conversions are driven by the digital ad, not the billboard. Fix: separate your retargeting audience from your organic conversion tracking and report them independently.
Skipping the attribution setup entirely: the most common mistake of all. Fix: add a vanity URL or promo code to the creative brief as a non-negotiable requirement, not an afterthought.
What billboard campaigns cost and when to expect measurable results
Primary cost drivers
- Format: digital OOH (DOOH) commands a premium over static bulletins; junior posters are the most affordable entry point.
- Market size: a bulletin in a top-10 DMA (New York, Los Angeles, Chicago) costs multiples of the same format in a secondary market.
- Location and traffic volume: high-visibility interstate locations cost more than arterial or side-street placements.
- Duration: most vendors price in four-week increments; longer commitments often yield rate discounts.
- Creative and production: static vinyl production runs $500–$1,500 per face; digital creative is typically lower cost but requires format-specific specs.
Illustrative price ranges by format and market
Ranges are illustrative. Actual pricing depends on vendor, specific location, traffic volume, and negotiated terms. Always request a formal rate card and Geopath impression data.
Timeline for measurable signals
| Signal | Typical Appearance | Notes |
|---|---|---|
| Branded search lift | Week 2–3 | Monitor weekly in Google Search Console |
| Vanity URL / promo code activity | Week 1–2 | Requires pre-launch tracking setup |
| Foot traffic / location visits | Week 3–4 | Needs geofencing or mobility analytics |
| Measurable sales signal | Week 4–8 | Depends on purchase cycle length |
| Reliable ROI calculation | Week 6–8 minimum | Shorter flights produce noisy data |
For small businesses considering whether billboards fit their budget, a practical overview of billboard options for small businesses can help frame the cost-benefit decision before committing to a vendor.
The practical rule: run a minimum of four weeks before drawing any conclusions, and plan for six to eight weeks if your goal is a defensible ROI calculation. Shorter flights generate awareness but rarely enough conversion data to calculate ROI with confidence.
How to think about ROI assumptions and communicate them clearly
Every billboard ROI calculation rests on assumptions. Declaring them upfront is what separates a credible analysis from a number that gets challenged in the next budget meeting.
Assumptions checklist — state all of these before presenting your ROI:
- Attribution window: how long after exposure will you count a conversion? (Recommended: 30–60 days for most consumer categories.)
- Conversion definition: what counts as a conversion? (A call, a store visit, a purchase, a form fill — pick one and stick to it.)
- CPM baseline: what CPM are you using to calculate media value, and where does it come from? (Geopath data, vendor rate card, or industry benchmark.)
- Audience overlap: are any impressions shared with another concurrent campaign? If so, how are you allocating credit?
- Seasonal adjustment: is the campaign period atypically high or low for your category? Adjust baseline conversion rates accordingly.
Still strong, but the direction matters when you are presenting to a skeptical CFO.
Communicating uncertainty to stakeholders: present a base case, a conservative case (half the conversion rate), and an optimistic case (double the conversion rate). Label each clearly. A range of $10,000–$40,000 in attributed revenue is more honest and more defensible than a single-point estimate of $20,000. Stakeholders who understand the range trust the analysis more, not less.
How 16wmediagroup measures and improves billboard ROI for local businesses
The workflow 16wmediagroup uses for local billboard campaigns starts with measurement infrastructure, not creative. Before a single vinyl goes up, the team sets up the tracking layer.
Measurement setup checklist:
- Dedicated vanity URL and landing page (GA4 goal configured before launch)
- Call-tracking number assigned to the billboard (separate from all other channels)
- Geofence perimeter set around each billboard location
- Baseline branded search volume recorded (four weeks pre-launch minimum)
- Control market identified if budget allows a geo-lift comparison
Mini case study — local consumer services client:
- Client context: a regional service business in the Tampa area seeking to grow brand recognition and drive inbound calls in a competitive local market.
- Campaign goal: increase branded search volume and inbound call volume by measurable amounts over an eight-week flight.
- Measurement approach: vanity URL tracking, dedicated call-tracking number, weekly branded search monitoring in Google Search Console, and a geofence comparison between the campaign market and a matched control ZIP code cluster.
- Results: branded search volume increased during the campaign flight relative to the pre-launch baseline; call volume from the dedicated tracking number exceeded the client’s pre-campaign monthly average. (Specific KPI figures are proprietary to the client.)
- Lesson learned: the geofence comparison revealed that foot traffic lift was concentrated within a 0.5-mile radius of each billboard, which informed placement decisions for the follow-on campaign.
Takeaways other marketers can copy from this playbook:
- Set up tracking before the creative is finalized, not after.
- Use at least two independent measurement signals (e.g., call tracking + branded search) to triangulate impact.
- Run a minimum four-week pre-launch baseline for every metric you plan to track.
- Document your assumptions and share them with the client or leadership team before the campaign starts.
For a broader measurement roadmap for local marketing ROI, the agency’s published playbook covers the full process from baseline to post-campaign analysis.
When billboards are a smart investment and when to skip them
Billboards work best for businesses where the customer is already physically nearby and the purchase cycle is short or repeat-driven. A local restaurant, a car wash, a gym, a dental practice, a retail store — these are natural fits. The customer drives past the billboard on the way to making the exact decision you want to influence.
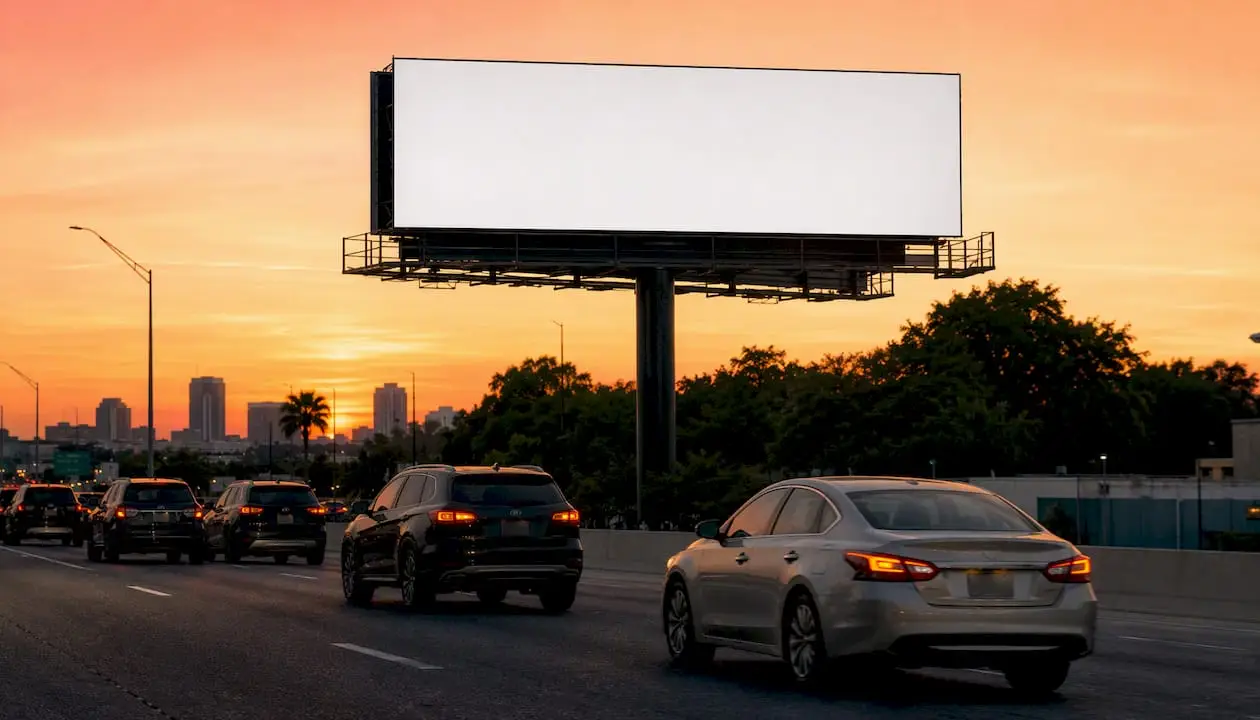
The fit weakens quickly for very narrow B2B audiences. If your buyer is a procurement manager at a Fortune 500 company, a billboard on I-275 in Tampa is not where that decision gets made. The audience density is too low and the placement is too broad to justify the CPM relative to targeted digital or account-based marketing.
Two quick scenarios:
Good fit: a local urgent care clinic running a bulletin on a high-traffic commuter route. The audience is broad (adults 25–64 in the surrounding ZIP codes), the purchase trigger is unpredictable (illness or injury), and repeated exposure builds the brand memory that drives the call when the moment arrives. Pair it with a branded search campaign and a call-tracking number, and you have a measurable, defensible ROI story.
Poor fit: a B2B software company selling enterprise HR platforms. The total addressable buyer pool in any metro is a few hundred HR directors. A billboard reaching 2,000,000 general-population impressions at $15,000 is a very expensive way to reach 200 relevant people. LinkedIn or targeted trade media will deliver a better cost-per-qualified-impression by a wide margin.
The honest guidance: if your customer base is geographically concentrated, visits or drives past your location regularly, and makes decisions influenced by brand familiarity, billboards belong in your local advertising mix. If your audience is defined by job title, industry, or a narrow behavioral profile rather than geography, spend the budget elsewhere and revisit OOH when your brand has broader consumer recognition to protect.
16wmediagroup can help you plan, place, and measure billboard campaigns
Local businesses in competitive markets like Tampa don’t need to guess at billboard ROI. 16wmediagroup builds the measurement infrastructure into every campaign from day one, so you walk away with data, not just impressions.
The agency handles the full campaign cycle: audience and route planning, creative development, vendor negotiation and placement, tracking setup (vanity URLs, call tracking, geofencing), and post-campaign ROI reporting. For clients who want to go deeper, the team runs geo-lift comparisons between exposed and control markets, giving you a defensible attribution story to bring to leadership.
An audit starts with a review of your current tracking setup, your existing campaign data, and your business goals. From there, the team builds a measurement plan before recommending any media spend. No guesswork, no inflated impression claims — just a clear plan tied to outcomes you can measure.
Ready to see what your billboard spend is actually returning? Review the local advertising best practices guide or explore 16wmediagroup’s full service offering to start the conversation.
Sources
- OAAA – OOH Ad Study (Morning Consult) March 2023
- Nielsen / OAAA Poster Study 2017
- How to Calculate Billboard ROI: A Step-by-Step Guide (Portma)