

Brand lift measurement quantifies the causal change in brand perceptions caused by advertising, calculated by comparing an exposed group against a matched control group that never saw the ad. It fits best for upper-funnel goals like awareness, ad recall, and favorability, especially for video, sponsorships, and other formats where conversions lag behind exposure. The result that actually counts is a statistically significant absolute lift, backed by confidence intervals and a sample large enough to trust.
TL;DR:
- Brands starting with high awareness, such as 85%, have minimal room for measurable lift, making it harder to detect statistically significant changes.
- Sample size must scale with low baseline metrics; detecting small lifts from under 15% awareness requires larger response groups.
- Verifying ad exposure through platform logs or pixel data is critical to ensure lift measurements reflect actual audience experience, not just assumptions.
- Significant results require a 95% confidence interval that does not cross zero, emphasizing the importance of adequate sample sizes and power calculations.
- Conducting lift studies throughout the full media flight, typically four to eight weeks, improves reliability, with early trends serving only as hypotheses.
Table of Contents
- Which Brand-Lift Metrics Should You Actually Track?
- How Do You Design a Valid Brand-Lift Study?
- How Do You Read the Statistics Behind a Lift Result?
- What Sample Size and Timeline Should You Plan For?
- How Do Reach and Frequency Shape Measurable Lift?
- Brand Lift or Incrementality Testing: Which Fits Your Goal?
- How Should You Report Lift Results and Act on Them?
- How Local and Multichannel Campaigns Put Lift Data to Work
- What’s the One Thing Advertisers Get Wrong About Brand Lift?
- How 16wmediagroup Turns Lift Data Into Local Media Decisions
- Where to Read More on Brand-Lift Methodology
- Sources
Which Brand-Lift Metrics Should You Actually Track?
Not every campaign needs to track every metric. Which ones matter depends on where your audience sits in the funnel and what the media buy was built to accomplish.
- Awareness: measures whether people recognize your brand exists at all. Prioritize it for new-market launches or rebrands where the baseline recognition is near zero.
- Ad recall: measures whether someone remembers seeing your specific ad, not just your brand. Use it for high-frequency video or audio campaigns where message delivery is the question.
- Familiarity: gauges how well people feel they know your brand beyond simple recognition. Track it during sustained, multi-quarter campaigns rather than one-off flights.
- Favorability: captures whether sentiment toward the brand improved. This is the metric to watch after reputation-focused or storytelling-driven creative.
- Consideration and purchase intent: measures movement toward an actual buying decision. Prioritize it for retail, auto, or high-ticket categories with longer purchase cycles.
- Message association: checks whether viewers connect a specific claim or tagline to your brand. Use it when the campaign’s job is to plant one idea, not general goodwill.
Two mechanical factors decide whether any of these numbers will move in a detectable way. The first is headroom: a brand already at 85% awareness has almost no room to climb, no matter how good the creative is, while a brand starting at 20% has plenty of runway. The second is baseline volatility. Metrics with naturally noisy baselines (favorability tends to swing more than raw awareness) need larger samples to separate real movement from statistical noise.
Survey questions should map cleanly to the metric. An awareness question asks respondents to recognize the brand from a list; a message-association question asks what claim they associate with a brand name. Mixing these frames into one ambiguous question is a common way studies produce shaky headline numbers.
How Do You Design a Valid Brand-Lift Study?
The credibility of any brand lift measurement study rests on how cleanly the exposed and control groups were separated. Get this step wrong and every downstream statistic is noise dressed up as insight.
- Assign randomly wherever possible. True random assignment, where eligible users are randomly withheld from ad delivery, is the gold standard because it eliminates selection bias. When a platform can’t randomize, use a matched observational design and run balance checks (comparing age, geography, and prior brand exposure across groups) before trusting the result.
- Verify exposure, don’t assume it. Rely on platform delivery logs, pixel or tag firing data, or panel-linkage methods that connect a survey respondent to confirmed ad delivery. Built In notes that brand lift measurement depends on comparing survey responses between a group that actually viewed the ad and a group withheld from it, which only works if exposure is verified rather than inferred.
- Time the survey deliberately. Field it close enough to exposure to avoid recall decay, but with enough gap to avoid contaminating responses with the ad still fresh in a way that inflates recall artificially. Most vendors field continuously throughout the flight rather than waiting until the campaign ends.
- Check platform eligibility before you commit budget. Ad platforms enforce minimum spend, minimum reach, and minimum response counts before a study can even produce a readable result, and some formats or narrow geographic targets simply don’t qualify.
Platform documentation on this is unusually specific: Display & Video 360’s measurement guidance walks through the “Not enough data” status message and the troubleshooting steps tied to low response volume or overly narrow targeting, which is worth reading before you assume a failed study means the ad didn’t work.
How Do You Read the Statistics Behind a Lift Result?
Every brand lift measurement report reduces to a handful of numbers, and reading them correctly is the difference between an actionable insight and a false conclusion sold with confidence.
Absolute lift is the simplest and most stable figure: exposed group percentage minus control group percentage. If a notable proportion of the exposed group recalls the ad versus a smaller proportion in the control group, absolute lift is the difference in percentage points between these two groups. Relative lift expresses that same gap as a percentage of the baseline, but it can badly overstate impact when the baseline is small.
Statistic Callout: A baseline awareness rate of just 5% that lifts to 7% looks unremarkable in absolute terms (2 points) but reads as a 40% relative increase. MetricGate’s methodology documentation recommends leading with absolute lift and confidence intervals for exactly this reason, since low baselines make relative figures easy to misread.
Significance testing typically relies on a two-proportion z-test or chi-square test, both of which answer a narrow question: is the gap between exposed and control groups larger than you’d expect from random sampling variation alone? A result is generally treated as significant when the 95% confidence interval around the lift doesn’t cross zero.
- Cohen’s h converts a percentage-point gap into a standardized effect size, letting you compare lift magnitude across studies with different baselines. Rough thresholds: 0.2 is small, 0.5 is medium, 0.8 or above is large.
- Statistical power tells you whether your sample was large enough to detect a real effect if one existed. A non-significant result from an underpowered study means “we don’t know,” not “there was no lift.”
Treat every non-significant finding as a question about sample size before treating it as a verdict on the creative.
What Sample Size and Timeline Should You Plan For?
Sample requirements in brand lift measurement scale inversely with your baseline rate and the size of the lift you’re hoping to detect. A campaign trying to move awareness from 10% to 15% needs a meaningfully larger sample than one moving favorability from 40% to 50%, because smaller absolute gaps require more statistical resolution to confirm.
- For a moderate baseline (30 to 50%) and a realistic 5 to 8 point lift, plan for several hundred completed responses per group at minimum.
- For low baselines (under 15%), expect to need a larger sample, since small percentages carry more sampling error relative to their size.
- Google’s Brand Lift documentation sets specific minimum response thresholds before a study is even eligible to report, which is worth checking against your expected reach before launch.
- Budget for the fact that low-baseline metrics inflate relative lift numbers, which can make a modest result look dramatic in a stakeholder deck.
Most reliable studies run across the full length of a media flight, typically four to eight weeks for mid-size campaigns, rather than trying to compress measurement into the first two weeks. Cutting the timeline short is the single most common way advertisers end up with an inconclusive read.
Pro Tip: Watch directional trends in the first third of a flight, but don’t act on them. Treat early movement as a hypothesis to confirm, not a decision to make budget calls on until the response threshold is met.
How Do Reach and Frequency Shape Measurable Lift?
Reach, impressions, and frequency describe the same delivery in three different ways, and the relationship between them is simple: frequency equals impressions divided by reach. Push more impressions into the same audience and frequency climbs; spread the same impressions across a wider audience and frequency drops.
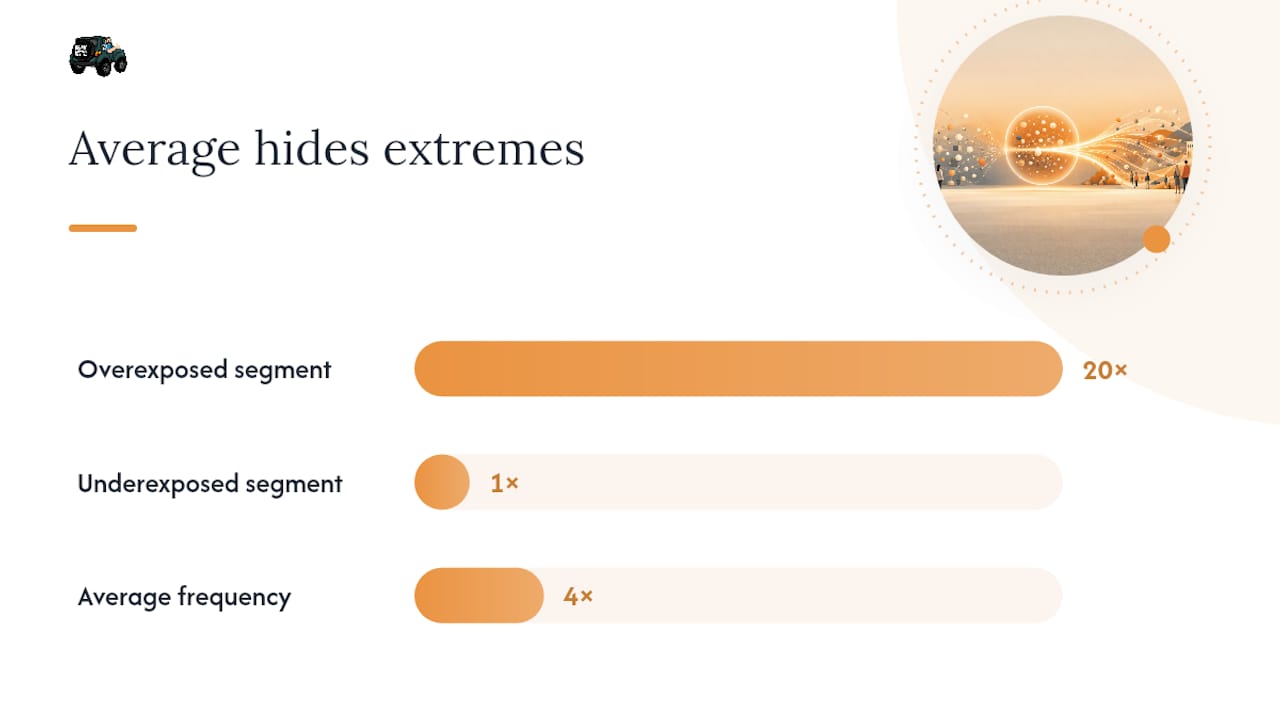
The mistake most advertisers make is optimizing to average frequency instead of frequency distribution. The Content Marketing Institute points out that an average frequency of 4 can mask a distribution where one segment sees the ad 20 times while another sees it once, and averages hide exactly the kind of overexposure that wastes budget without adding lift.
- Frequency caps limit how many times one person sees an ad, protecting against fatigue in the overexposed segment.
- Cost-per-unique-reach is a more honest efficiency metric than cost-per-impression when the goal is upper-funnel lift.
- Signs of audience exhaustion include flattening lift despite rising spend, a signal that additional frequency has stopped producing marginal perception gains.
- Awareness objectives generally favor broader reach at moderate frequency; consideration and intent objectives often need higher frequency against a narrower, more qualified audience.
Sound reach and frequency planning at the exposure design stage makes the eventual lift study far easier to interpret.
Brand Lift or Incrementality Testing: Which Fits Your Goal?
Brand lift measurement and incrementality testing answer different questions, and confusing them leads to the wrong test at the wrong stage of the funnel.
- Brand lift fits campaigns built around perception: awareness pushes, sponsorship activations, video where a click was never the goal.
- Incrementality or conversion testing fits campaigns where a purchase, signup, or store visit is the measurable outcome and attribution data already exists.
- Combine both when you need the full ROI story: brand lift explains why perception moved, and incrementality testing or advertising ROI analysis shows what that perception shift was worth downstream.
A workable combined workflow: run a brand-lift study on the upper-funnel video flight, run a geo-based incrementality test on the retargeting layer feeding off that same audience, then compare the timing of perception gains against the timing of conversion gains. As MetricGate’s guidance on pairing brand studies with behavioral testing notes, brand lift is especially valuable for video-heavy and sponsorship campaigns where last-click data simply can’t tell the story.
How Should You Report Lift Results and Act on Them?
A lift report earns its place on a stakeholder’s desk when it leads with the numbers that actually drive decisions, not a wall of raw survey output.
- Absolute lift and its confidence interval, stated together, so nobody mistakes a marginal result for a strong one.
- Lifted users, an estimate of how many people the campaign actually moved, and cost per lifted user, which turns perception change into a spend efficiency figure.
- Segment-level lift broken out by age, geography, or platform, run through interaction tests to confirm whether one segment is truly driving the result.
- A note on power for any segment that came back non-significant, since a small subgroup sample often can’t detect a real effect.
Vendors including Nielsen, Dynata, and DISQO build benchmark databases specifically so a single lift number means something in context. Nielsen’s brand lift reporting standardizes on lifted users, cost per lifted user, and 95% confidence reporting, giving advertisers a common language across vendors and campaigns.
| Element | What it tells you |
|---|---|
| Absolute lift + CI | Whether the effect is real and how big it is |
| Cost per lifted user | Efficiency of the spend that produced the effect |
| Segment-level lift | Which audiences to prioritize next flight |
| Longitudinal benchmark | Whether this campaign beat your own historical norm |
Use significant segment findings to steer creative iteration for the next flight, and log results into a longitudinal benchmark so each new campaign gets judged against your own track record, not an industry average that may not fit your category.
How Local and Multichannel Campaigns Put Lift Data to Work
Brand lift measurement isn’t just a video-platform exercise. Community magazines, sponsored podcast segments, and local digital placements can all feed into a lift design when exposure can be tagged, coded, or proxied through unique promo codes, dedicated landing pages, or panel matching against known listener or reader lists.
A regional home services client running a mixed flight of community magazine ads, a sponsored podcast segment, and digital display saw favorability lift concentrated almost entirely in the podcast-exposed segment, with digital display showing a smaller, less reliable movement. Reallocating a larger share of the next quarter’s budget toward the podcast placement produced a stronger favorability result at a lower cost per lifted user than the display-heavy mix it replaced.
- Match exposure to a proxy signal (a unique code, a landing page, a listener panel) whenever platform-level tagging isn’t available.
- Tie lift findings to a local outcome, like foot traffic or store visits, whenever the business has a physical location to track against.
- Treat any single-channel result cautiously in a multichannel flight; segment-level analysis is what tells you which channel actually earned the credit.
Pro Tip: A media planning checklist built before launch, not after, is what makes exposure proxying possible in the first place. Retrofitting measurement onto a campaign that’s already running rarely works.
What’s the One Thing Advertisers Get Wrong About Brand Lift?
Most advertisers treat a non-significant brand lift result as proof the campaign failed. That’s usually the wrong conclusion. A study that comes back inconclusive more often means the sample never reached the response threshold needed to detect the effect, not that the creative or media plan underperformed. Confusing “we couldn’t measure it” with “it didn’t happen” is the single most expensive misreading in this field, because it leads teams to kill campaigns that were actually working.
My prioritized recommendation: run brand lift studies alongside every major video flight, and commit in writing, before the campaign launches, to a minimum response threshold you’ll wait for before judging the result, guided by how to analyze social video performance metrics to optimize campaign impact How To Analyze Social Video Performance Metrics. Deciding that threshold after the numbers come in is how confirmation bias creeps into reporting.
The 48 to 72 hour action is simple. Pull your last three campaign reports and check whether any inconclusive result actually met the platform’s minimum response count. If it didn’t, that campaign’s verdict is still open, not closed. If your team needs help building that kind of measurement discipline into a media plan from the start, 16wmediagroup works through exactly this setup with local advertisers.
— Mike
How 16wmediagroup Turns Lift Data Into Local Media Decisions
Running a clean brand lift measurement study takes coordinated exposure tracking across every channel in the mix, which is exactly where a lot of advertisers get stuck doing it alone. 16wmediagroup builds the local media plan first, with exposure tracking designed in from the start rather than bolted on afterward, so a podcast segment, a community magazine ad, and a digital display flight can all be measured on the same timeline instead of guessed at separately.
Handling this in-house works when you already have a data team and platform access across every channel you’re running. It stops working the moment your mix spans traditional and digital media, which is where most local and regional campaigns actually live. 16wmediagroup’s local advertising best practices guide walks through how a media plan gets structured for measurement from day one, including how cross-channel exposure gets tracked well enough to support a real lift study. If your next campaign needs that kind of setup, that guide is the place to start.
Where to Read More on Brand-Lift Methodology
For readers who want to go deeper on the mechanics covered here, these are worth bookmarking:
- Google Ads Brand Lift help: covers required response thresholds and platform-specific reporting terms.
- Display & Video 360 measurement guidance: explains the “Not enough data” status and common troubleshooting fixes.
- MetricGate’s brand lift documentation: a methodological reference for significance testing, Cohen’s h, and power analysis.
- Nielsen’s brand lift solution overview: shows benchmark reporting conventions used across the industry.
Sources
- Brand Lift Measurement | MetricGate docs
- Brand Lift — Google Ads Help
- What is brand lift? — Built In