

Across industries in 2026, the average cost per lead sits around $213.60, but that number alone tells you almost nothing useful. The real work is comparing your blended CPL to the industry and channel bands in the table below, then tracing any gap back to the two levers that actually move the needle, cost per click and conversion rate.
Before you get there, four forces drive CPL up or down in every campaign:
- CPC pressure. Rising auction costs on Google Ads and Meta Ads push CPL higher even when your conversion rate holds steady.
- Conversion rate. A landing page that converts at 8% instead of 4% cuts your CPL in half with zero change to ad spend.
- Funnel stage and lead definition. A top-of-funnel (TOFU) contact costs far less than a sales-qualified lead (SQL) — sometimes 5–10x less.
- Offer quality and seasonality. A compelling offer in a low-competition window can compress CPL dramatically; Q4 retail and tax-season financial services campaigns routinely spike costs.
Key Takeaways
The most important thing CPL benchmarks tell you is where to start the conversation, not where to end it — pair every CPL figure with SQL conversion rate and deal size before making budget decisions.
| Point | Details |
|---|---|
| Cross-industry average CPL | FoundryCRO puts the 2026 blended average at $213.60, with verticals ranging from ~$29 to $900+. |
| Channel CPL varies sharply | Google Ads median is ~$47; Meta is ~$22; LinkedIn is ~$75 — each reflects a different intent and lead quality level. |
| Set targets from LTV, not benchmarks | Work backward from gross margin and funnel conversion rates to calculate your allowable CPL before comparing to industry data. |
| Conversion rate is the key lever | When CPCs rise, improving landing page and form conversion rate is the most controllable way to reduce CPL. |
| 16wmediagroup local planning | 16wmediagroup builds channel-specific media plans that translate national CPL benchmarks into local campaign targets. |
Table of Contents
- What do cost per lead benchmarks look like by industry?
- How does CPL shift by channel and funnel stage?
- How do you calculate cost per lead correctly?
- What counts as a reasonable CPL for your business?
- What are the most effective tactics to lower your CPL?
- How should you read these benchmarks?
- Applying national CPL benchmarks to local advertisers
- The number that matters most isn’t CPL
- How 16wmediagroup helps local advertisers put benchmarks to work
- Sources
What do cost per lead benchmarks look like by industry?
Benchmarketing recommends reading the P25–P75 percentile band rather than a single cross-industry average, because a mean pulled by outlier industries (higher education, enterprise SaaS) can mislead the majority of advertisers. The table below uses median CPL where available, with range bands and data notes.
Three outliers worth understanding:
- Automotive repair sits at the low end (~$29) because search intent is hyper-specific (“oil change near me”), competition is local rather than national, and the sales cycle is hours, not months.
- Higher education exceeds $900 because enrollment decisions involve months of nurturing, compliance-heavy creative, and fierce competition among institutions for a finite pool of applicants each cycle.
- B2B enterprise SaaS pushes past $450 because the denominator is a genuine SQL, not a form fill. When you count only leads that a sales team has accepted, CPL naturally climbs.
The cross-industry blended average of $213.60 is useful as a sanity check, but your real benchmark is the row that matches your vertical, deal size, and lead definition. When your CPL sits above the P75 band for your industry, that gap is the starting point for an optimization conversation, not a cause for alarm on its own.
Pro Tip: If your industry isn’t in this table, use the closest vertical by deal size and sales cycle length, then adjust your target CPL proportionally based on your average contract value.
How does CPL shift by channel and funnel stage?
Channel choice shapes CPL as much as industry does. A $75 LinkedIn lead and a $22 Meta lead are not the same product — they differ in intent, qualification level, and downstream close rate.
Channel-by-channel snapshot:
- Google Ads (paid search): Median CPL around $47, with a platform average near $79. High purchase intent makes this the go-to for bottom-of-funnel campaigns, but rising CPCs have pushed costs up year-over-year. Acceptable CPL ceiling is higher here because lead quality tends to be strong.
- Meta Ads (Facebook/Instagram): Median CPL around $22, platform average near $26. Broad reach and precise demographic targeting keep costs low, but TOFU leads often need more nurturing before they qualify. Recent auction changes have compressed some efficiency gains.
- LinkedIn Ads: Median CPL around $75, with B2B Lead Gen Forms typically delivering $85–$140 versus website-conversion campaigns at $130–$300+. The premium is justified for B2B deals with high average contract values (ACVs). For a $50,000 ACV deal, a $120 LinkedIn lead is a bargain.
- Email outbound: CPL varies widely by list quality and sequence sophistication, but B2B outbound email often lands in the $40–$100 range for an initial response. Volume is the constraint, not cost.
- Organic/SEO: Near-zero marginal cost per lead once content ranks, but 6–18 months to meaningful volume. The effective CPL amortized over content production and SEO investment often runs $30–$80 for mature programs.
- Events and webinars: Registration CPLs can look attractive ($20–$60), but attended-and-engaged CPLs run 2–3x higher once no-show rates are factored in.
The Adv highlight a critical nuance: LinkedIn Lead Gen Forms often produce lower CPLs than website-conversion campaigns, but the quality profile differs. Form-fill leads skip the friction of a landing page visit, which means they may be less committed. Always track Lead Gen Form leads separately and compare their SQL conversion rate before declaring them the winner.
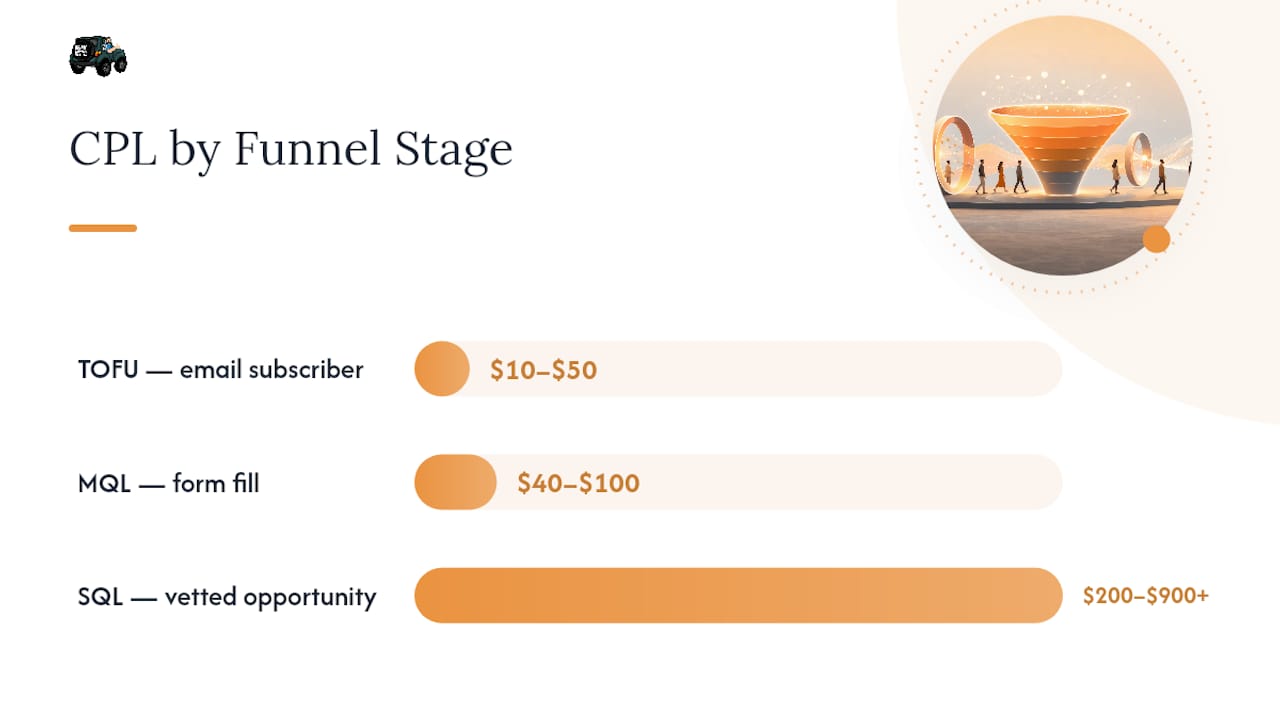
Funnel stage CPL bands (representative, cross-channel):
| Funnel Stage | Typical CPL Band | What You’re Buying |
|---|---|---|
| TOFU (awareness/content) | $10–$50 | Email subscriber, content download |
| MQL (marketing qualified) | $40–$100 | Form fill, demo request, trial signup |
| SQL (sales accepted) | $200–$900+ | Vetted, sales-ready opportunity |
Benchmarketing’s objective-level data puts the lead-generation median CPL at $48, with top-quartile performers at $27 and bottom-quartile at $101. If your paid campaigns are consistently above $101, you’re in the bottom quartile — and that’s the clearest signal to audit targeting and landing page experience before adding budget.
How do you calculate cost per lead correctly?
That formula is simple. What trips teams up is inconsistency in what goes into “total campaign cost.” Klipfolio’s CPL guidance emphasizes that defining the numerator explicitly is the difference between benchmarks you can trust and numbers that mislead.
What belongs in the numerator: Ad spend (the media buy itself), platform fees, creative production costs directly tied to the campaign (copywriting, design, video), and a proportional allocation of campaign management time.
What to leave out: General brand overhead, executive salaries not tied to campaign execution, and website hosting costs that serve the whole business. Including these inflates CPL in a way that makes comparisons to industry benchmarks meaningless.
Worked example 1 — local home services SMB:
A Tampa-area HVAC company runs a Google Ads campaign for one month. Ad spend: $3,000. Agency management fee allocated to this campaign: $500. Creative (landing page update): $200. Total cost: $3,700. Leads generated (form fills + tracked calls): 62. CPL = $3,700 ÷ 62 = $59.68. That sits comfortably within the home services median band.
Worked example 2 — B2B SaaS:
A software company runs LinkedIn Ads and a webinar series. LinkedIn spend: $8,000. Webinar platform and promotion: $2,000. Creative and copy: $1,500. Management allocation: $1,000. Total: $12,500. MQLs generated: 55. CPL = $12,500 ÷ 55 = $227.27. Within the B2B SaaS MQL range, though worth tracking SQL conversion rate to confirm lead quality.
Attribution model matters more than most teams realize. Last-click attribution assigns full CPL credit to the final touchpoint before conversion, which tends to favor branded search and retargeting while undervaluing awareness channels. First-click does the opposite. Data-driven attribution (available in Google Ads and GA4) distributes credit across the path. Whichever model you choose, use it consistently so your CPL trends are comparable month over month. Switching models mid-campaign is the fastest way to make good performance look bad and vice versa.
What counts as a reasonable CPL for your business?
There is no universal “good” CPL. The right number for your business comes from your lifetime value (LTV), gross margin, and sales funnel conversion rates — not from a benchmark table alone. MarketingCharts confirms that CPL only becomes meaningful when paired with downstream conversion and deal-size data.
Here’s a three-step workflow to set your own target:
-
Calculate LTV and gross margin. If your average customer generates $4,800 in revenue over their lifetime and your gross margin is 60%, the gross profit per customer is $2,880.
-
Work backward from your target CAC and payback window. If you want to recover customer acquisition cost within 12 months and your close rate from MQL to customer is 15%, your allowable cost per MQL is: $2,880 × 15% = $432 maximum CAC. For B2B businesses, CAC payback period guidance by ACV band suggests 12–18 months is typical for SMB deals under $25,000 ACV.
-
Allocate CPL by channel and funnel conversion rates. If your MQL-to-SQL rate is 40% and your SQL-to-close rate is 35%, your lead-to-close rate is 14%. With a $432 CAC ceiling, your target CPL is $432 × 14% = $60.48 per lead. That’s your number — not the industry average.
Pro Tip: Track CPL and SQL conversion rate side by side. Raw CPL without quality context is a vanity metric.
What are the most effective tactics to lower your CPL?
Two levers move CPL: reduce what you pay per click, or increase the rate at which clicks become leads. When CPCs are rising across platforms (and they have been, year-over-year), conversion rate improvement is often the only lever you fully control.
Audience refinement
Tightening your targeting is the fastest way to stop paying for clicks that will never convert. On Google Ads, switching broad-match keywords to phrase or exact match typically reduces wasted spend within two to three weeks. On Meta, layering behavioral signals on top of demographic targeting narrows the audience but raises intent. The trade-off: smaller reach, lower volume. Run both in parallel for 30 days before committing budget to one.
Creative testing
Ad creative accounts for a disproportionate share of CPL variance, particularly on Meta and display. Test one variable at a time (headline, image, CTA copy) with a minimum of 500 impressions per variant before drawing conclusions. Anything less and you’re reading noise.
Landing page optimization
This is where most local advertisers leave money on the table. A landing page with a clear headline, one focused offer, and a short form (3–5 fields) consistently outperforms a general homepage. Conversion rate improvement through landing page testing is one of the highest-leverage moves available, particularly for service businesses where the form fill is the lead.

Retargeting
Keep retargeting audiences fresh (30-day windows work well for most service businesses) and use different creative than your prospecting ads. Expected effect: medium to large on CPL, with smaller volume.
Channel mix and budget reallocation
Organic and community-based channels (local publishing, podcast sponsorships, community events) carry near-zero marginal CPL once the relationship is established, but they require time to build. Blending one or two paid channels with a community media presence tends to lower blended CPL over a 6–12 month horizon. For guidance on simplifying multi-channel advertising, the channel mix matters as much as any individual tactic.
Measurement discipline: Run any single tactic test for a minimum of two weeks and 50+ conversions before judging results. Fewer data points and you’re optimizing toward statistical noise. Set a measurement window before you start, not after you see the numbers.
Pro Tip: Before adding budget to a new channel, audit your existing landing pages and lead forms first. Most CPL problems are conversion problems, not traffic problems.
How should you read these benchmarks?
Every benchmark in this article draws from multiple sources, each with its own methodology. Knowing where the numbers come from helps you decide how much weight to give them.
Primary sources used:
- FoundryCRO (2026): Cross-industry CPL averages and vertical ranges based on aggregated campaign data. Covers Google Ads and Meta Ads platform-level averages alongside industry rows. Best for: industry-level comparisons.
- Benchmarketing (2026): Channel medians and percentile bands (P25, median, P75) across paid search, social, and display. Uses the “4-Band Method” to contextualize performance. Best for: channel-specific benchmarks and understanding where you sit in the distribution.
- ADV.me (2026): B2B-specific channel bands including LinkedIn Lead Gen Forms vs. website conversion campaigns, email outbound, and webinars. Best for: B2B lead generation planning.
- MarketingCharts: Historical and revenue-sliced CPL data showing variation by company size and vertical. Best for: understanding how company scale affects CPL expectations.
- Bowen AI Strategy Group (2026): CAC payback period guidance by ACV band for B2B businesses. Best for: target-setting workflows tied to deal size.
Caveats to keep in mind:
- Sample composition skew. Aggregated datasets often over-represent larger accounts with higher budgets, which can pull averages up. Smaller local advertisers may see different CPL dynamics.
- Campaign objective differences. A “lead generation” campaign optimized for form fills produces different CPLs than one optimized for phone calls or store visits — even in the same industry.
- Seasonal bias. Most published benchmarks reflect annual averages. Q4 and industry-specific peak seasons (tax season for financial services, back-to-school for education) can push CPLs 20–40% above annual medians.
- Geography. National averages don’t account for local market competition. A Tampa home services advertiser competes in a different auction than a rural Midwest counterpart.
To validate whether a benchmark applies to your account: match on industry, average deal size or ACV, campaign objective (lead gen vs. brand awareness), and geography. If three of four match, the benchmark is a reasonable starting point. If only one matches, treat it as directional context rather than a hard target.
Applying national CPL benchmarks to local advertisers
National averages are a compass, not a GPS. A local service business in Tampa running a $2,000/month campaign operates in a fundamentally different competitive environment than a national brand spending $200,000/month on the same keywords.
What local advertisers typically see:
- Local paid search CPLs often run below national averages in less competitive markets, because fewer advertisers are bidding on hyper-local keywords (“HVAC repair Westchase” vs. “HVAC repair”).
- Community media channels (local magazines, podcast sponsorships, neighborhood events) carry CPLs that are harder to measure directly but often deliver strong lead quality because they reach an engaged, trust-primed audience.
- Mixed-media campaigns that combine digital ads with community publishing tend to lower blended CPL over time, as brand familiarity reduces the friction that drives up paid CPL.
Channel priorities for local businesses:
- Start with local paid search (Google Ads with geo-targeting) for immediate, intent-driven leads.
- Layer in Meta Ads for awareness and retargeting once your landing page converts reliably.
- Add community media (local magazines, podcasts, events) to build the brand trust that makes every paid click cheaper over time.
- Consider local advertising channels for service businesses as a framework for sequencing your channel investment.
Measuring local campaign ROI: Offline conversions are real and often undercounted. Track phone calls with a dedicated tracking number, ask new customers how they heard about you, and use UTM parameters on every digital touchpoint. For community media placements, a simple “mention this ad” offer or a unique landing page URL gives you attribution data without complex technology.
Pro Tip: For mixed-media local campaigns, measure CPL separately by channel for the first 90 days, then calculate a blended CPL. The blended number is what you optimize against long-term, because community channels reduce paid CPL over time as brand awareness grows.
To get a localized CPL estimate built around your specific market, offer, and channel mix, 16wmediagroup’s local advertising campaign planning process is the right starting point.
The number that matters most isn’t CPL
Most marketing teams treat CPL as the final verdict on a campaign. It’s not. It’s the opening argument.
CPL tells you what you paid to get someone to raise their hand. It says nothing about whether that hand belonged to someone who would ever buy. The campaigns I’ve seen fail most expensively weren’t the ones with high CPLs — they were the ones with low CPLs and terrible SQL conversion rates. The math isn’t subtle.
The practical takeaway: before you optimize CPL downward, confirm that your current leads are converting to customers at a rate that makes your unit economics work. If they are, then CPL reduction is pure upside. If they aren’t, cutting CPL further just means more of the wrong leads, faster.
How 16wmediagroup helps local advertisers put benchmarks to work
Knowing your target CPL is one thing. Building the campaign that hits it is another. 16wmediagroup works with local and regional businesses to translate benchmark data into executable media plans across digital ads, community magazines, podcast sponsorships, and traditional media placements. The approach is practical: start with your offer, your market, and your unit economics, then build a channel mix that fits your budget and your timeline.
No guaranteed CPLs — results depend on your offer, your market, and how well your funnel converts. What 16wmediagroup does guarantee is a media plan grounded in real benchmark data and local market knowledge, not generic templates. If you’re ready to build a plan that connects your CPL targets to an actual channel strategy, start with the local advertising best practices guide or reach out directly to get a planning estimate built for your market.
Sources
These are the primary references behind the data in this article. Each covers a distinct slice of the CPL picture.
- Cost Per Lead Benchmarks by Industry 2026 + Free Calculator
- Adv
- CPL Benchmarks 2026 | Benchmarketing
- Cost per Lead (CPL) Benchmarks, by Industry, Revenue and Company Size