

Foot traffic attribution links a digital ad exposure to a real, physical store visit, giving advertisers proof that a campaign moved someone off their couch and through a door. Its core value is simple: it converts guesswork about offline impact into a measurable outcome, using anchors like Google’s store visit conversions and polygon-based visit detection. Agencies like 16wmediagroup apply this logic in local campaigns to prove that community-level media spend actually fills seats and storefronts.
TL;DR:
- Foot traffic attribution requires accurate building footprints and precise dwell-time thresholds tailored to business types to reduce false positives.
- Location data sources like GPS, Wi-Fi, Bluetooth, and POS must be blended and cleaned to improve visit detection accuracy, especially in dense retail areas.
- Estimated visit numbers are often modeled and should be validated through control groups and sensitivity tests, as direct observation is limited by privacy rules.
- Data collection thresholds meant to protect privacy can cause small-scale campaigns to fall below reporting limits, making modeled estimates the only option at low volume.
- Effectiveness varies by industry, with quick-service restaurants seeing 2.5% to 8.8% lift, and longer attribution windows benefiting service providers with delayed conversions.
Table of Contents
- What Does Foot Traffic Attribution Actually Measure?
- How Does Foot Traffic Attribution Work Behind the Scenes?
- How Accurate Is Foot Traffic Attribution Data?
- Which Advertising Channels Can You Actually Measure?
- How Should You Define a “Visit” for Attribution Purposes?
- How Do You Set Up Foot Traffic Attribution?
- What Metrics Prove Foot Traffic Attribution ROI?
- What Does Good Foot Traffic Attribution Look Like by Industry?
- What Are the Privacy Limits on Foot Traffic Data?
- How 16wmediagroup Applies Foot Traffic Measurement Locally
- When Is Foot Traffic Attribution Worth the Investment?
- Turn Ad Spend Into Store Visits With 16wmediagroup
- Sources
What Does Foot Traffic Attribution Actually Measure?
Online attribution tracks clicks, form fills, and add-to-carts. Foot traffic attribution tracks something harder to fake: a person’s device physically arriving at a business location after seeing an ad. That difference matters more than it sounds. Foursquare’s attribution research found that clicks alone can miss up to 80% of actual store visits, because most people who see an ad and later walk into a store never click anything at all. They just show up.
The offline conversion event here is a visit, not a session or a submitted form. That shift changes what “success” looks like for a local campaign, and it requires a different measurement chain entirely.
The process generally runs through four stages:
- Exposure: a device (or household, in CTV’s case) is served an ad tied to a location-based campaign.
- Matching: that exposed device is matched, using hashed or privacy-safe identifiers, to a pool of observed location signals.
- Visit detection: location data confirms whether that device later entered a defined point-of-interest boundary.
- Attribution: the visit is credited back to the ad exposure within a set time window.
None of this produces certainty. Foot traffic attribution is probabilistic, built on statistical confidence rather than a verified receipt. It works best at scale, across many exposures and many locations, where patterns become reliable even if any single match is not. A single-location boutique running a small campaign will get noisier, less conclusive signals than a ten-location regional chain.
How Does Foot Traffic Attribution Work Behind the Scenes?
The mechanics start with raw location data. Vendors typically pull from GPS pings on mobile devices, Wi-Fi and Bluetooth beacon signals inside or near a venue, household-level exposure logs from connected TV, and sometimes POS or CRM data as a validation layer. Each source has a different resolution and a different blind spot, which is why most serious attribution systems blend several.
The bigger accuracy lever is how a “location” gets defined on a map. Older systems drew a centroid-radius geofence, a simple circle around a business’s address point. That approach breaks down fast in strip malls, shopping centers, and mixed-use buildings, where a circle radius happily scoops up the yoga studio next door along with the coffee shop you’re trying to measure. SafeGraph’s attribution methodology recommends building-footprint polygons instead, shapes that trace a business’s actual physical structure, paired with a spatial hierarchy that understands which businesses share a building or a parking lot.
Before any of that mapping happens, the raw GPS data needs cleaning. That means stripping out pings with poor horizontal accuracy, filtering non-stationary readings (someone driving past isn’t a visit), clustering the remaining pings into candidate stops, and applying dwell-time thresholds to separate a real visit from a five-second pass-through. In dense retail corridors, where three restaurants might share one polygon boundary, machine learning models step in to resolve ambiguous clusters using signals like entry point, dwell pattern, and time of day.
How Accurate Is Foot Traffic Attribution Data?
Vendors report two very different kinds of numbers, and conflating them is the single most common mistake local advertisers make. Observed visits come from actual device signals confirming someone was physically present. Modeled (or projected) visits are statistical estimates extrapolated from a sample when direct observation is incomplete, which happens often given privacy sampling limits and inconsistent device permissions.
Foursquare’s own data shows that click-based tracking alone misses up to 80% of real store visits, which is exactly why the industry shifted toward movement-based and POI-based detection instead of relying on last-click credit.
Common error sources compound the challenge. GPS drift can place a device several hundred feet off its true location. Drive-bys near a storefront can register as false visits if dwell filtering is weak. Shared parking lots and multi-tenant buildings routinely cause misattribution when polygon boundaries aren’t precise.
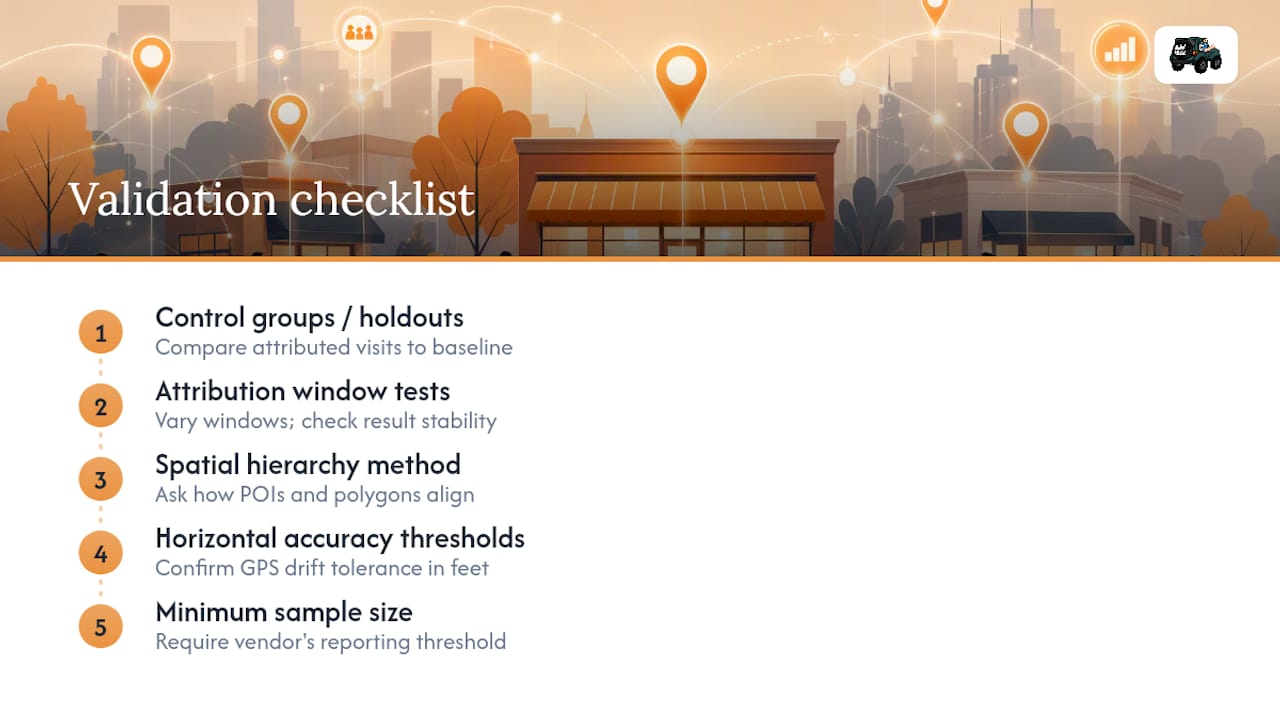
The fix isn’t a single number, it’s validation. Run control groups or geo holdouts to see whether attributed visits actually exceed a baseline. Test sensitivity across different attribution windows to see if results hold steady or swing wildly. When evaluating a vendor, ask directly about their spatial hierarchy method, their horizontal accuracy thresholds, and the minimum sample size before they’ll report a number at all. A vendor who can’t answer those three questions clearly is asking you to trust a black box.
Which Advertising Channels Can You Actually Measure?
Not every channel connects to store visits with the same confidence level, and knowing the ceiling on each one saves you from overpromising results to a client or a boss.
- Mobile in-app and display: the strongest option, since device-level exposure data can be matched directly to device-level location signals.
- Connected TV: measured at the household level rather than the individual device, which means visit attribution here leans more heavily on modeling.
- DOOH and programmatic display: exposure is inferred rather than confirmed, using estimated dwell time near a screen or timing windows around an ad flight.
- Paid social and search: harder to connect to visits directly unless the platform pairs its own reporting with device-level location signals, as Google does with store visit conversions.
Location-based marketing works best when the tactic matches the goal. Braze’s location marketing guidance points out that geofencing suits proximity-based targeting, while beacons are built for measuring in-store interaction once a customer has already arrived.
How Should You Define a “Visit” for Attribution Purposes?
The definition you choose changes your results more than almost any other setting in the system. A five-minute dwell threshold might make sense for a quick-service restaurant but wildly undercount visits to a furniture showroom, where fifteen or twenty minutes is a normal browsing pattern.
A few starting points that hold up across categories:
- Set dwell time by business type. QSR and convenience categories often use short thresholds (around 3 to 5 minutes), while big-box retail, auto dealerships, and healthcare offices need longer windows to separate a real visit from a parking-lot pass-through.
- Start attribution windows at 3, 7, or 14 days, then test longer windows for high-consideration purchases like furniture or home services, where the gap between ad exposure and visit can stretch weeks.
- Exclude employee and delivery devices from your visit counts, since staff and delivery drivers will otherwise inflate numbers with visits that have nothing to do with your campaign.
- Filter shared parking lots separately from the storefront polygon itself, especially in strip malls or shopping centers.
Pro Tip: Combine a building-footprint polygon with a category-aware dwell rule and a time-of-day filter. That three-layer approach catches false positives that any single filter would miss on its own, particularly in dense retail corridors where several businesses sit within a few dozen feet of each other.
How Do You Set Up Foot Traffic Attribution?
Getting from zero to a working measurement system takes real setup work, not a toggle switch. Most local advertisers can move from planning to actionable data within four to eight weeks, depending on how many locations they’re measuring and how clean their existing location data already is.
- Verify and enrich your location data. Confirm every store’s polygon matches its real-world footprint, verify addresses, and map each location to the correct NAICS category so dwell-time defaults make sense.
- Connect location assets to your ad accounts. Link your verified business locations inside Google Ads, and confirm you have enough exposure volume to clear the platform’s privacy thresholds, since Google withholds store visit reporting below a minimum interaction count.
- Set a store-visit conversion value. Assign a dollar value to a visit based on average transaction size, then feed that value into Smart Bidding where the platform supports it.
- Run a holdout or control test before scaling spend. Compare an exposed group against a geographic or audience holdout to confirm the lift is real, not a coincidence of seasonal foot traffic.
A few things trip up almost everyone the first time through:
- Reporting lags behind reality. Google notes that store visit conversions are logged by interaction date, not visit date, so expect a delay before numbers stabilize.
- Small-location advertisers often hit privacy sample thresholds and simply won’t see reporting for weeks, which isn’t a system failure, it’s a volume problem.
- Skipping the holdout test is the most common shortcut, and it’s the one that leads to the worst decisions, since incrementality testing is what actually separates causation from coincidence.
What Metrics Prove Foot Traffic Attribution ROI?
Four numbers matter more than the rest: attributed visits, incremental lift over a control group, store-visit rate (visits divided by exposures), and cost per incremental visit. That last figure is the one that should drive budget conversations, since it converts a marketing number into a business number a store owner immediately understands.
None of these numbers mean much sitting alone. Triangulate visit lift against POS transaction trends, loyalty program sign-ups, appointment book counts, or call-tracking data, and the picture gets far more convincing. A retailer seeing a 12% lift in attributed visits alongside a matching bump in POS transactions during the same window has real evidence. A retailer seeing lift with flat POS numbers has a data quality problem worth investigating before spending more.
Expect a reporting cadence measured in weeks, not days. Short-term swings are usually noise, driven by weather, local events, or simple sampling variance, and they smooth out over a full attribution window.
What Does Good Foot Traffic Attribution Look Like by Industry?
Results vary enormously by category, and setting expectations against the wrong benchmark is a fast way to call a working campaign a failure.
- Quick-service restaurants: proximity geofencing around competitor locations or high-traffic corridors, sometimes called micro-conquest campaigns, has produced lift in the 2.5% to 8.8% range in Foursquare’s case studies for well-targeted proximity promotions.
- Retail chains: multi-location brands use store-level creative testing to see which messaging drives visits in specific neighborhoods, then apply those findings to site-selection decisions for future locations.
- Service providers: dentists, salons, and home-service businesses benefit from longer attribution windows and appointment-linked measurement, since the gap between seeing an ad and booking a visit often runs days or weeks rather than hours.
What Are the Privacy Limits on Foot Traffic Data?
Not every account or location will get store-visit reporting, and that’s by design, not by accident. Google and most location vendors enforce minimum interaction and sample-size thresholds before releasing any visit data, specifically to protect individual privacy. A single-location small business running a modest campaign may simply fall below that line for weeks or months.
When volume is thin, vendors often shift to modeled visits, statistical projections rather than direct observations. Treat those numbers as directional, not definitive. The safest posture: use foot traffic attribution as one input among several, and validate any meaningful budget decision with a lift test or a straightforward before-and-after POS comparison rather than trusting a single dashboard number in isolation.
How 16wmediagroup Applies Foot Traffic Measurement Locally
16wmediagroup builds foot traffic measurement into local campaigns from day one: verifying every client location’s polygon, choosing dwell settings by business category, and running holdouts before scaling spend. Community media, from local publishing placements to podcast features, pairs with location-based digital tracking so clients see which channel actually moved people through the door. For a deeper walkthrough of the process, our measurable local advertising results guide breaks down the specifics.

When Is Foot Traffic Attribution Worth the Investment?
Attribution earns its cost once a business runs enough locations or enough monthly ad spend to clear privacy sample thresholds reliably, usually multi-location brands or single locations spending several thousand dollars a month. Below that scale, a straightforward lift test beats an always-on attribution subscription. Fold whatever you learn into media mix decisions gradually, not all at once, since one strong quarter of data rarely justifies rewriting an entire budget.
— Mike
Turn Ad Spend Into Store Visits With 16wmediagroup
16wmediagroup is the alternative to guessing whether your local ads work at all: instead of watching a click count and hoping it means something, you get a media plan built around whether people actually walked into your business. Our team handles the polygon verification, dwell-time settings, and holdout testing that most local businesses don’t have the bandwidth to manage alone, paired with the traditional and digital channels, from radio to podcasts to community publishing, that actually reach your neighborhood.

If you want a full framework before committing to a campaign, our Local Advertising Best Practices guide walks through exactly how we structure location-based measurement for clients across categories. Ready to see what a tailored media plan looks like for your storefront? Reach out to our team and we’ll map out a campaign built around real, measurable visits.
Sources
- Foursquare — advertising and sales attribution guide
- About store visit conversions – Google Ads Help
- Store Visit Attribution: Methods, Data & How It Works — SafeGraph
- Foot Traffic Attribution: What It Measures and How to Use — AiDigital